

Process Mapping: Definition, Benefits, and Implementation
Process mapping visualizes all of an organization’s operations by grouping them into three categories: management, operational, and support. Essential for meeting the requirements of standards such as ISO 9001, it identifies bottlenecks, reduces costs by 20 to 30 percent, and improves operational efficiency. Unlike theoretical approaches that get bogged down in complex modeling, process mapping can be implemented quickly by any small or medium-sized business, without any prior technical expertise. Here’s how to create a process map and capitalize on its measurable benefits:
Table of Contents
- What is process mapping?
- Why Map Your Processes?
- The Measurable Benefits of Mapping
- An Explanation of the Three Categories of Processes
- How do you create a process map?
- Example of a mapping exercise for an SME
- Frequently Asked Questions
What is process mapping?
Process mapping is a structured visual representation of all of an organization’s activities, showing how resources, information, and tasks are linked to produce a result. It forms the backbone of any continuous improvement and operational management initiative.
Definition and Key Objectives
A process map visually illustrates how an organization operates internally: who does what, in what order, using what resources, and with what expected outcome. It does more than simply list tasks—it shows their interdependencies, information flows, and decision points.
There are multiple objectives: identifying the sources of problems, standardizing practices to ensure quality, facilitating the onboarding of new employees, and preparing for certification such as ISO 9001. Without this big-picture view, each department works in isolation and repeats the same mistakes without realizing it.
The three process categories (management, operational, and support)
Every organization structures its activities into three broad categories, as recognized by international quality standards.
| Process Type | Primary Role | Key Activities | Impact & Characteristics |
|---|---|---|---|
| Management Process | Coordinating the organization and establishing the strategic framework |
| Provides direction and oversees the operation of business and support processes. |
| Operational Processes | Directly create value for the customer (core business) |
| Priorities in any process mapping. |
| Support Process | Facilitates overall operations without creating direct value |
| Essentials: If they fail, they can bring operational processes to a standstill. |
Macroscopic vs. Detailed Mapping
Macroscopic mapping, or Level 0 mapping, depicts the organization as a whole. It identifies the major processes and their relationships without going into detail about sub-activities. It is the logical starting point: it provides the big-picture view needed to prioritize improvement efforts.
Detailed mapping breaks things down to the level of individual tasks, responsible parties, and milestones for each process. It is used to analyze a specific problem, train employees, or prepare for automation. The two levels are complementary: the macro level provides a strategic overview, while the detailed level guides operational action.
Why Map Your Processes?
Mapping business processes is not a theoretical exercise reserved for large companies. It is an operational tool that produces concrete results in the short term, regardless of the organization’s size.
Identify bottlenecks and inefficiencies
A bottleneck is a step that slows down the entire upstream flow. It can be a routine manual validation, a transfer of information between two teams that do not communicate through the same channel, or a task performed by a single person without a documented procedure.
Mapping makes these bottlenecks visible. Without a visual representation, they are perceived as isolated problems, and no one has the big picture needed to resolve them structurally. With mapping, the root cause becomes apparent within a few minutes of collective analysis.
Improving communication and knowledge sharing
Undocumented processes rely on the memories of the most senior employees. When one of them leaves the organization, they take years of tacit knowledge with them. Process mapping converts this tacit knowledge into a shared repository accessible to all teams.
It also plays a key role in onboarding new employees. Someone with an up-to-date map can understand in a matter of hours what would otherwise have taken weeks of informal learning.
Facilitating ISO 9001 Compliance and Quality Audits
AFNOR oversees ISO 9001 certification in France. This standard explicitly requires the documentation and management of organizational processes: each process must have defined criteria, established methods, and monitored results. Process mapping forms the basis of the documentation reviewed during audits.
Without structured mapping, preparing for an ISO 9001 audit amounts to rushing to put together documentation—which results in incomplete and unconvincing materials for the auditors. An organization that maps its processes on an ongoing basis passes its audits without stress.
Reduce operating costs and production cycles
Mapping does not directly reduce costs; rather, it reveals where those costs are hidden. Duplicate data entry, unnecessary back-and-forth, waiting between steps, redundant approvals—every inefficiency has a measurable cost. Once visualized, these losses can be prioritized.
According to an analysis by cflowapps.com (2026), 21% of companies that have optimized their processes achieve savings of at least 10%. Operational cost reductions can reach 20 to 30% in organizations that implement a structured optimization approach.
The Measurable Benefits of Mapping
Process mapping yields quantifiable results, not just qualitative improvements. The available data makes it possible to accurately define the expected gains even before getting started.
Efficiency gains and cycle time reductions
Process mapping followed by targeted optimization can lead to a 20 to 50 percent improvement in operational efficiency, according to analyses published by helpjuice.com based on McKinsey research (2026). This wide range reflects the diversity of starting points: an organization with undocumented processes reaches the upper end of this range, while an organization that is already structured tends to fall toward the lower end.
The benefits are primarily related to cycles: reduced processing time, elimination of wait times between steps, and elimination of backtracking caused by missing information at the right time.
Cost savings achieved by companies
The cost savings resulting from the automation of well-documented processes are substantial. According to cflowapps.com (2026), organizations that automate their processes after mapping them save an average of $51,000 per year. The ROI multiplier reaches 2.1 when the initiative is accompanied by structured team training.
These figures do not take into account indirect benefits: fewer processing errors, higher customer satisfaction, and lower turnover resulting from repeated operational frustrations.
Impact on Digital Transformation
Digital transformation fails when it automates flawed processes rather than improving them first. According to cflowapps.com (2026), 70% of digital transformation initiatives fail, and the lack of process documentation is among the major causes identified.
Mapping out the process before automating it ensures that the digital tool replicates the correct process—not a degraded version or an existing malfunction. It is this sequence that ensures the success of digitization projects.
An Explanation of the Three Categories of Processes
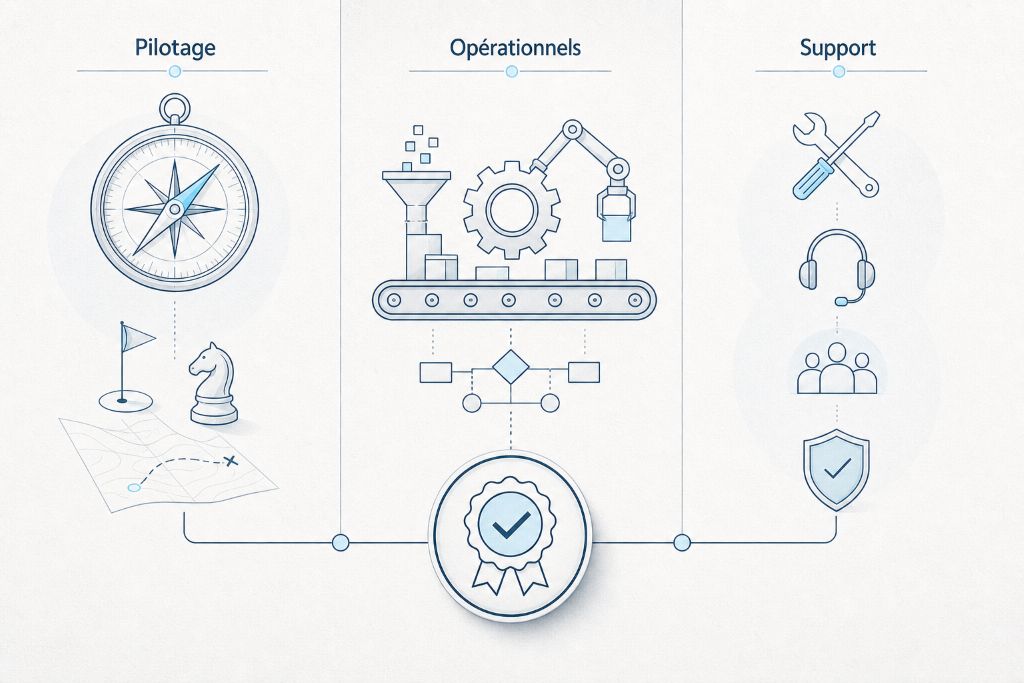
Understanding the three categories of processes allows you to structure the process map in a logical and recognized way that is compatible with quality standards such as ISO 9001.
Steering Processes: Strategy and Management
Governance processes define the organization’s direction, priorities, and operating rules. They include strategic planning, management reviews, performance metric monitoring, and risk management.
In an SME, these processes remain informal and centered on the leader until a structured approach formalizes them. Mapping them out makes it possible to gradually delegate them, make them auditable, and create a management framework shared with the teams.
Operational Processes: Creating Customer Value
These are the processes for which the customer pays. They transform a request into a deliverable: quoting, production, delivery, billing, and claims management. Every organization has its own set of operational processes based on its industry and business model.
In an industrial small or medium-sized business, the core operational process is production. In a service company, it is the customer project. Process mapping begins with these processes, as they define the value created and the customer’s expectations.
Support Process: Cross-Functional Resources
Support processes ensure the organization’s operational capacity: human resources management, accounting and finance, information systems, purchasing and procurement, and equipment maintenance.
They do not directly create value for the customer, but their failure disrupts operational processes. A delay in payroll, an unmanaged IT outage, or a failed supply chain delivery directly impacts production. Mapping support processes helps identify dependencies between process families and define internal service levels.
How do you create a process map?
Mapping business processes follows a step-by-step, five-step approach. The approach described here requires no technical expertise and is well-suited for small and medium-sized businesses and mid-sized companies that are just getting started with this process.
Step 1: Identify the customer’s needs and the main workflow
Mapping begins with the customer, not with the internal organizational chart. The first question is: What does the customer receive, and where does their journey with the organization begin? This outward focus prevents us from replicating the hierarchical structure in the form of processes, which is the most common mistake.
The main flow—from order to delivery, from request to response—becomes the backbone of the mapping process. Everything else connects to it, either upstream or downstream.
Step 2: List the organization’s major processes
Once you have identified the main process, list all the processes that contribute to or support it. Do not try to be exhaustive at this stage: aim for a list of high-level processes without going into detail about sub-activities.
A half-day group workshop with the heads of each department is sufficient to compile this initial list. The scope depends on the complexity of the organization, not on a specific standard to be met.
Step 3: Classify and Organize Processes
Each process on the list is assigned to one of three categories: management, operational, or support. The processes are then organized based on their relationships: which process feeds into which other process, what information flows between two processes, and what triggers exist.
This step produces the macroscopic mapping. It can be represented as a three-column table or a diagram showing information flows between blocks. The format is less important than readability for the teams involved.
Step 4: Define Inputs, Outputs, and Indicators
For each identified process, define the triggering event (customer order, internal request, information received), the expected output (deliverable, decision, document), and the metric that measures its performance (lead time, error rate, volume processed).
This formalization transforms mapping into a management tool, rather than just a static representation. A process without metrics cannot be improved in a measurable and traceable way.
Step 5: Review with the operational teams
A process map validated solely by management is rarely accurate. Operational teams are aware of the discrepancies between the theoretical process and day-to-day reality. Validation on the ground corrects these discrepancies before they become persistent blind spots.
This step also fosters buy-in: employees who helped create the map are its strongest advocates and the most attentive to keeping it up to date.
Example of a mapping exercise for an SME
A small service-sector business illustrates how simple mapping can structure an organization without complicating its management. The no-code approach makes this process accessible without the need for an outside vendor or IT expertise.
General structure suitable for small organizations
For an SME, a three-level high-level process map is sufficient. It includes management processes, operational processes, and support processes, the number of which varies depending on the organization’s complexity. The goal is not exhaustiveness but clarity: a process map that is kept up to date by the teams is more valuable than an exhaustive inventory that no one consults.
Visualization can start on a whiteboard or in a spreadsheet, then transition to a digital tool as the process matures. The key is to get started—don’t wait for the perfect tool.
Key processes to map
In a small-to-medium-sized service company, the processes that should be mapped as a priority are: sales management (from prospecting to contract signing), service delivery (from order placement to delivery), billing and collections, HR management (recruitment, training, payroll), and financial management.
These processes account for the bulk of the value created and the operational risks. Secondary processes may undergo a second iteration once the first version has been stabilized and accepted by the teams.
Common Mistakes to Avoid
The first mistake is to confuse mapping with an organizational chart. An organizational chart shows who reports to whom—a map describes what happens to create value. These are two distinct tools with different uses.
The second mistake is to map processes without metrics. A process that isn’t measured cannot be systematically improved. Defining at least one metric per key process from the very first version is essential for success.
The third mistake is failing to update the map. A map that remains static quickly becomes inaccurate—and then counterproductive. Establishing a regular review cycle is just as essential as the mapping process itself.
For small and medium-sized businesses that want to go beyond static mapping and automate their processes without IT development, MAGIC BPM allows them to move directly from process mapping to automated execution, without any technical intermediaries.
Frequently Asked Questions
Process mapping is a structured visual representation of all an organization’s activities, showing their sequences, the people involved, and their expected outcomes. It should be led by a quality manager, an operations director, or a cross-functional project manager, with the active participation of the managers responsible for each process. In an SME, it is the CEO who initiates the process during a growth phase or in preparation for quality certification.
Macroscopic mapping depicts the organization as a whole: the major processes and their relationships, without delving into the details of individual tasks. It serves to provide an overview and to prioritize efforts. Detailed mapping delves into the level of individual activities, stakeholders, and milestones for a specific process. It is used for training, analyzing malfunctions, or preparing for automation. The two levels are complementary and correspond to different phases of organizational maturity.
ISO 9001 requires the documentation and management of an organization’s processes, which involves some form of process mapping. AFNOR specifies that the standard requires identifying processes and their interactions, defining their criteria and methods, and monitoring their results. Structured process mapping is the most effective way to meet these requirements and demonstrate compliance during an audit. Without it, the organization cannot prove to auditors that it has control over its activities.
ROI depends on the initial maturity of the processes. Organizations that undertake structured optimization reduce their operating costs by 20 to 30% (cflowapps.com, 2026). Those that combine this approach with structured team training increase their ROI by a factor of 2.1. Savings from automating well-documented processes average $51,000 per year per organization, according to the same source.
A bottleneck occurs where tasks pile up and are left pending: approval by a single manager, the transfer of information between two unconnected systems, or a decision that hasn’t been delegated. To identify them, follow the workflow from start to finish and pinpoint every point where progress depends on a single resource or a structural delay. These points are the top priorities for optimization, because resolving them unblocks the entire upstream workflow.
SMEs and mid-sized companies can start with simple tools such as spreadsheets or diagrams on paper before moving on to digital solutions. No-code business process management platforms make it possible to move from process mapping to automation without any IT development skills. MAGIC BPM, which has been in development since 2010, offers this approach for all industries and organizations of all sizes, without the need for a technical service provider.

